
By John C. Zaher
The Evolution of U.S. National Debt and Deficits
The history of U.S. national debt and annual deficits is a complex story shaped by wars, economic crises, policy decisions, and demographic changes. Since 1900, the U.S. government has experienced significant fluctuations in revenue and spending, culminating in today’s rising debt and deficits. Understanding the trajectory of debt over the last century helps explain the current economic challenges and forecasts potential risks ahead. This article traces key periods in federal spending and deficit trends, analyzing the impact of major policy shifts. We’ll look at the impact of the COVID-19 pandemic, and, later, we’ll examine the economic consequences and dangers of the nation’s staggering debt level, which now totals an astounding $34 trillion, or 130% of Gross Domestic Product (GDP).
U.S. National Debt and Deficits: 1900-1920s
At the dawn of the 20th century, the U.S. federal government maintained a relatively low debt level. Federal revenue was derived primarily from tariffs, as the income tax had not yet become a consistent source of revenue. However, World War I (1914-1918) marked a turning point in the fiscal history of the U.S. The war effort significantly increased federal government spending, and between 1917 and 1918, debt levels surged as the government financed the war through bond sales and borrowing. By the end of World War I, U.S. debt had increased from $3 billion to approximately $25 billion.
The Great Depression, Deficit Spending, and Keynesian Economics
The Great Depression (1929-1939) fundamentally reshaped federal fiscal policies. Under the leadership of President Franklin D. Roosevelt, the New Deal programs aimed to combat the economic collapse through deficit spending, a concept rooted in Keynesian economics. British economist John Maynard Keynes advocated for increased government spending during times of economic downturns to stimulate demand and revitalize the economy.
World War II (1939-1945) followed, and the war effort required even greater levels of deficit spending. From 1940 to 1945, U.S. government debt exploded, increasing from $42 billion to $269 billion. The war not only solidified the practice of deficit spending as an economic policy tool but also laid the groundwork for Keynesianism to dominate U.S. fiscal policy in the decades that followed.
Post-World War II: Normalization and Growth
After World War II, the U.S. government transitioned into a period of relative fiscal restraint. Federal spending was normalized, and although the national debt remained high, economic growth throughout the 1950s and 1960s helped stabilize debt-to-GDP ratios. This period saw a significant increase in government revenue due to strong economic expansion, which helped mitigate concerns about the size of the national debt. Importantly, during the 1950s and 1960s, the government focused on balancing the budget and keeping deficits low. But while balanced budgets will improve debt-to-GDP ratios, they don’t pay down the debt. As Keynes argued, deficit spending and debts during poor economic times to stimulate the economy should be offset by surpluses in strong economic periods, resulting in debt reductions. What Keynes may not have appreciated was that it is a lot easier politically to increase spending and cut taxes, rather than cut spending or increase taxes.
The Reagan Era: Tax Cuts and Military Spending
The 1980s ushered in a new era of fiscal policy under President Ronald Reagan. Reagan’s economic agenda, often referred to as “Reaganomics,” included significant tax cuts aimed at stimulating economic growth. The Economic Recovery Tax Act of 1981 lowered the top marginal tax rate from 70% to 50%, and subsequent cuts brought it down to 28% by the end of Reagan’s presidency.
However, despite promises to reduce the size of government, federal spending continued to rise — particularly in defense and social programs. Military spending surged due to the Cold War, while social spending remained high as entitlement programs expanded. The result was a ballooning federal deficit. By the end of Reagan’s presidency in 1988, the U.S. debt had tripled, rising from $900 billion to $2.7 trillion.
George H.W. Bush and Bill Clinton: A Return to Fiscal Discipline
Reagan’s successor, President George H.W. Bush, faced increasing pressure to address the growing deficit. Deficits and debts still mattered during this period! In 1990, Bush agreed to a budget deal that included tax increases — despite his famous campaign pledge, “Read my lips: no new taxes.” This move, combined with spending cuts, helped reduce the deficit somewhat but proved politically damaging for Bush.
With the support of a Democrat-controlled Congress, President Bill Clinton, who took office in 1993, implemented further tax increases, notably through the Omnibus Budget Reconciliation Act of 1993. Additionally, Clinton benefitted from a Republican-controlled Congress after 1994, which led to significant fiscal restraint. Speaker of the House Newt Gingrich and the Republican majority prioritized balancing the budget, and by the late 1990s, the U.S. government recorded annual surpluses for the first time in decades (1998-2000). From a fiscal perspective, a divided government worked during this period, restraining fiscal spending, along with a “peace dividend” from the end of the Cold War. Policy perspectives would soon change.
2000s: Tax Cuts, Wars, and Stimulus Spending
The surpluses of the Clinton years quickly evaporated under President George W. Bush. The Bush administration implemented two rounds of tax cuts (in 2001 and 2003), significantly reducing federal revenue. At the same time, defense spending increased due to the wars in Afghanistan and Iraq following the 9/11 attacks. The combination of reduced revenue and increased spending led to rising deficits once again. Perhaps more importantly, attitudes towards the debt and deficits seemed to have changed. A balanced budget wouldn’t come in the way of a tax cut and government spending. This contrasted with Reagan, who, while he wanted to cut taxes, also sought to cut government spending. This, along with economic growth from the tax cuts, would result in increased revenue, keeping deficits in check.
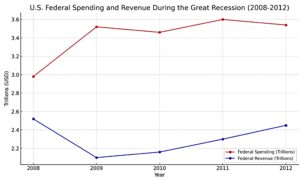
The 2008 financial crisis and the subsequent Great Recession exacerbated the fiscal situation. In response, the U.S. government implemented massive stimulus measures, including the Troubled Asset Relief Program (TARP) and the American Recovery and Reinvestment Act (ARRA). These efforts, while necessary to prevent economic collapse, caused the national debt to surge further. Between 2008 and 2012, annual deficits reached a higher of $1.3 trillion, increasing the national debt by $5.57 trillion in just five years.
Chart: Federal Spending and Revenue During the Great Recession
The Impact of Entitlements and an Aging Population
One of the key drivers of U.S. government debt has been the increase in entitlement spending, particularly Social Security, Medicare, and Medicaid. As the U.S. population ages, the costs associated with these programs have risen significantly. The Social Security Trust Fund, which helps fund retiree benefits, is projected to be depleted by 2034 unless reforms are enacted. Currently, the balance of the Social Security Trust Fund stands at approximately $2.8 trillion, but it is steadily being drawn down as the number of beneficiaries grows. In addition, for many years, Social Security and Medicare revenues exceeded payments made to beneficiaries. Since the government first borrowed from itself through the Trust Fund, this helped to alleviate the overall debt burden; however, now, expenditures exceed revenues, adding the need to borrow to meet the costs of entitlement spending.
Chart: Entitlement Spending as a Percentage of Federal Debt
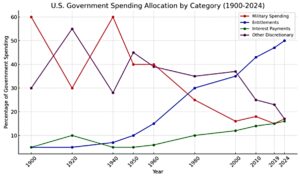
This chart shows changes in the allocation of government spending over time. Entitlements now exceed 50% of government expenditures, while military spending has averaged around 15% and is now nearly exceeded by interest payments on the debt (16% as compared to 15%, see below).
The Impact of COVID-19: Budgeting from a New Base
Exponential Debt Growth Since 2020: COVID-19 and Stimulus Measures
Part II of this article discusses the impact of the COVID-19 pandemic and how the Biden administration budgeted from a new base, perpetuating multi-trillion-dollar deficits and spiraling national debt.
The COVID-19 pandemic triggered an unprecedented level of government spending. Under President Donald Trump, the CARES Act was enacted in March 2020, which provided trillions of dollars in relief through stimulus checks, unemployment benefits, and business loans. These measures, while necessary to prevent a complete economic collapse, contributed to the largest single-year increase in U.S. national debt in history.
The Biden administration continued significant levels of fiscal support through additional COVID-19 relief packages, including the American Rescue Plan in 2021. Moreover, Biden’s ambitious Build Back Better Act further contributed to deficit spending as the government focused on infrastructure, climate change, and social programs.
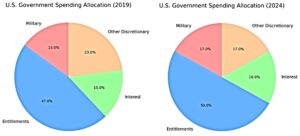
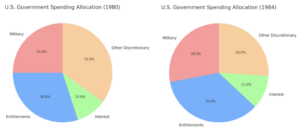
Pie charts show changes in spending before COVID-19 and 2024.
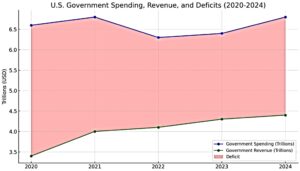
This chart below shows differences in government spending and revenue from 2020 to 2024, resulting in large annual deficits, increasing the debt from $23 trillion to $34 trillion in just five years.
Here’s a list of key government programs and spending initiatives that significantly contributed to the rise in U.S. debt from 2020 to 2024:
COVID-19 Response and Economic Stimulus:
- CARES Act (Coronavirus Aid, Relief, and Economic Security Act) – 2020:
- A $2.2 trillion economic relief package aimed at providing direct payments to individuals, enhanced unemployment benefits, small business loans (Paycheck Protection Program), and funding for healthcare and local governments.
- American Rescue Plan Act – 2021:
- A $1.9 trillion stimulus package providing additional direct payments, extended unemployment benefits, expanded child tax credits, and funding for vaccines, schools, and state/local governments.
- Paycheck Protection Program (PPP):
- Billions were provided in forgivable loans to small businesses to keep employees on payroll during the COVID-19 pandemic.
- Unemployment Insurance Enhancements:
- Extended unemployment benefits with an additional $600 per week, later reduced to $300 per week in subsequent packages. These benefits continued well into 2021.
- Healthcare and Vaccine Funding:
- Significant funds were allocated for COVID-19 vaccine development, distribution, and healthcare support. This included hospital reimbursements, free testing, and treatment.
Economic Recovery and Infrastructure Initiatives:
- Infrastructure Investment and Jobs Act – 2021:
- A $1.2 trillion bipartisan infrastructure law aimed at modernizing roads, bridges, public transit, broadband internet, and clean energy projects over a decade.
- Build Back Better Act (proposed, partially enacted):
- While the full version wasn’t passed, parts of the act were enacted in other bills, increasing spending on social programs like childcare, healthcare subsidies, and climate initiatives.
Social Welfare and Entitlement Spending:
- Medicare, Medicaid, and Social Security:
- Entitlement programs continued to expand due to the aging population, with Medicare and Medicaid costs increasing significantly.
- Affordable Care Act Subsidies:
- Additional funds were allocated to support the expansion of healthcare subsidies for lower-income households under the Affordable Care Act.
Defense and Military Spending:
- Defense Budget Increases:
- The defense budget remained at substantial levels during this period, with spending aimed at modernizing military capabilities, cybersecurity, and global defense commitments.
Interest Payments on National Debt:
- Rising Interest Payments:
- As the debt ballooned, interest payments became a larger portion of the federal budget. Despite historically low interest rates, the sheer size of the debt led to rising costs of servicing the debt.
Disaster Relief and Emergency Funding:
- Federal Emergency Management Agency (FEMA) Spending:
- Billions were spent on disaster relief, including responses to hurricanes, wildfires, and other natural disasters that continued to hit the U.S. during these years.
When government spends more money to deal with a crisis, the tendency is that it will continue to spend at a higher rate and not reduce spending to pre-crisis levels when the crisis has passed. This is exactly what happened during the Biden administration. These programs, combined with existing obligations such as entitlements and military spending, caused a dramatic rise in government debt from 2020 to 2024.
Medicare, Medicaid, and Social Security:
- Social Security:
Social Security spending was around $1.1 trillion annually during the 2020-2024 period. - Medicare:
Medicare spending during this period was approximately $800 billion per year. - Medicaid:
Medicaid spending was around $600 billion annually.
Affordable Care Act (ACA) Subsidies:
- The American Rescue Plan temporarily expanded Affordable Care Act subsidies, providing an additional $34 billion in healthcare subsidies from 2021 through 2022.
Defense and Military Spending:
- U.S. military spending remained elevated, with annual budgets hovering around $700 billion to $750 billion from 2020 to 2024.
Interest Payments on National Debt:
- As the debt rose and interest rates increased in 2023 and 2024, the amount the government paid to service the debt increased dramatically with annual interest payments now exceeding $1 trillion.
Disaster Relief and Emergency Funding (FEMA):
- FEMA’s annual disaster relief and emergency spending increased significantly during this period, with annual outlays ranging between $50 billion to $60 billion, depending on the year and severity of natural disasters.
Since 2020, both political parties have played politics with the debt. On an almost annual basis, there have been threats of government shutdowns when budgets are not passed on time and votes are not taken to increase the debt ceiling. The parties have argued over tax cuts and government spending, but there’s been very little political will to cut government spending and increase taxes. In fact, temporary measures enacted to deal with crises such as the 9-11/the wars on terrorism, the 2008 financial crisis and COVID-19 have only served to increase a higher budget base. This, combined with lower tax rates, has swelled deficits and debts. With annual deficits reaching 47.8% of all spending in 2020, and the debt totaling $34 trillion in 2024, representing 130% of GDP, there appears no end in sight. In the short term, larger debts are impacting annual budgets. With interest rates higher, interest on the debt is projected to approach nearly $1 trillion this year. This not only leaves fewer resources for government programs, but also perpetuates the debts as the government continues to borrow to pay for expenditures including interest. It makes you ask the question. “What would happen if inflation and higher rates persist and those who purchase treasuries and government bonds lost confidence in the United States’ ability to pay its debts?”
Chart: U.S. Debt and Deficits Post-2020
The Dangers of Debt and Deficits
Here, we explore the dangers posed by mounting debt. As U.S. debt continues to rise, economists and policymakers warn of several risks associated with sustained multi-trillion-dollar deficits.
Crowding Out: Interest Payments on Debt
As the national debt increases, the U.S. government must pay more in interest. Interest payments on the debt are now one of the largest components of the federal budget. When interest rates were low following the 2008 financial crisis, these payments were relatively manageable. However, as interest rates have risen over the past several years and the debt has grown, a larger portion of the budget is dedicated to servicing debt rather than funding essential programs. The U.S. government issues Treasury bonds and bills to finance its debt, which are auctioned off to investors. If demand for U.S. debt declines, the interest rates the government must offer to attract buyers will rise, further exacerbating the budget deficit. See the chart below on annual interest payments.
U.S. Federal Government Annual Interest Payments on Debt (2008-2024)
| Year | Net Interest Payments (in billions USD) |
|---|---|
| 2008 | $240 billion |
| 2009 | $180 billion |
| 2010 | $190 billion |
| 2011 | $220 billion |
| 2012 | $210 billion |
| 2013 | $215 billion |
| 2014 | $222 billion |
| 2015 | $218 billion |
| 2016 | $235 billion |
| 2017 | $270 billion |
| 2018 | $315 billion |
| 2019 | $360 billion |
| 2020 | $330 billion |
| 2021 | $340 billion |
| 2022 | $450 billion |
| 2023 | $560 billion |
| 2024 | $882 billion |
| 2025 | $952 billion projected |
* This chart shows net interest payments made by the federal government which represents the difference between gross interest paid by the federal government to service the debt less interest income earned by the federal government.
Risk of Default
In a worst-case scenario, the U.S. government could default on its debt. A default would have catastrophic consequences for both the domestic and global economy. Inflation could skyrocket as investors lose confidence in the U.S. dollar, and the resulting economic instability could lead to a global depression. Policymakers argue that default remains unlikely, but poor fiscal policies exacerbated by political division can create a scenario of political impasse to fund the government or raise the debt ceiling. If markets lose confidence in the United States and the dollar, it is foreseeable that investors will move away from the U.S. and invest in other assets, including precious metals or bitcoin, which have risen to record highs in recent months. While the Federal Reserve will be sure to intervene to increase its purchases and stabilize markets, how large can its balance sheet grow? At $6.9 trillion, The Federal Reserve already holds about $5.3 trillion in treasury securities. One can only envision the doomsday scenarios on the world economy and security if the United States government defaults on its debt.
Navigating the Future of U.S. Fiscal Policy
The U.S. has faced numerous fiscal challenges over the past century, and the trajectory of national debt and deficits is now at a critical juncture. While government spending during crises such as wars, economic downturns, and pandemics has often been necessary, the rapid growth of debt presents long-term risks to economic stability. With entitlement programs consuming a growing share of the budget and interest payments on the rise, policymakers must confront the challenge of restoring fiscal responsibility. Whether through tax reform, spending cuts, or structural reforms to entitlement programs, the U.S. must develop a sustainable fiscal path forward to ensure economic prosperity for future generations. This is the challenge for the Trump administration. Will the administration work with Congress and have fiscal restraint? Will Elon Musk’s Department of Government Efficiency (DOGE) fulfill its promises of reducing the budget deficit by $2 trillion per year?
Here’s a list of the U.S. federal government’s annual interest payments on the national debt from 2008 to 2024. These figures are estimates, with more recent years reflecting projected numbers based on current trends and rising debt levels.
Additional Charts
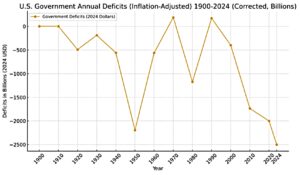
This chart shows that, for much of U.S. history, the government maintained balanced budgets. During wars, the Great Depression, financial crises and COVID-19, deficits increased.
This chart shows annual budgets as a percentage of GDP. Not since World War II has the U.S. government run such large annual deficits, greatly increasing the debt.
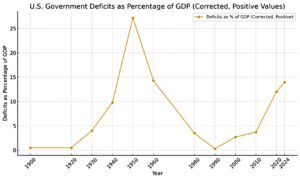
This chart shows annual deficits and surpluses over time in 2024 dollars. For much of United States history, fiscal policy was to maintain a balanced budget.
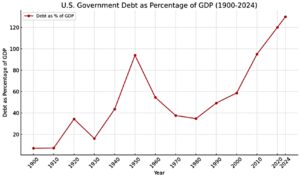
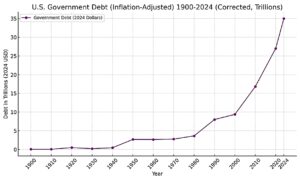
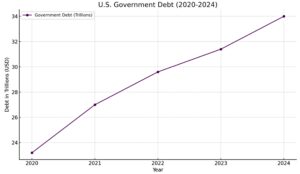
This chart shows the growth of the U.S debt over time. The current debt now amounts to 120.7% of GDP.
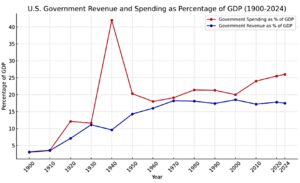 This chart shows the annual comparison of spending and revenue as a percent of GDP. The chart demonstrates how government spending and revenue have grown as a percentage of the economy over time, as well as the growth in spending since 2020 as compared to revenue, resulting in large deficits and accumulation of government debt.
Sources for the Charts:
- U.S. Department of the Treasury: Historical Debt Outstanding data and federal revenue.
- URL: treasury.gov
- Office of Management and Budget (OMB): Historical Tables, including federal spending and revenue data.
- URL: whitehouse.gov/omb
- Federal Reserve Bank of St. Louis (FRED): Data on government debt, deficits, and debt-to-GDP ratios.
- URL: fred.stlouisfed.org
- U.S. Bureau of Economic Analysis (BEA): GDP data used to calculate debt and deficits as a percentage of GDP.
- URL: bea.gov
- Congressional Budget Office (CBO): Provides projections and historical data on government spending, revenue, and debt.
- URL: cbo.gov
- Historical Statistics of the United States: Covers U.S. economic indicators like government spending and revenue across centuries.
Sources for the Article:
- Keynes, J. M. (1936). The General Theory of Employment, Interest and Money. For a foundational understanding of Keynesian economics.
- Blinder, A. S. (2008). Keynesian Economics: The History and Principles. Princeton University Press.
- U.S. Congressional Research Service (CRS): Research papers on the impact of wars, economic crises, and policies on national debt.
- Historical Budget of the U.S. Government (OMB): For historical context and specific policies across different presidencies.
- Brookings Institution: For policy analysis on tax reforms and the relationship between revenue and spending.
- Social Security Administration (SSA): For information on the Social Security Trust Fund and entitlement spending trends.
*ChatGPT was used to assist with researching and creating the charts used in this article.